2025 Market Year-in-Review
| Asset Class | Ticker | 2025 Return |
|---|---|---|
| Precious Metals | ||
| Gold | GLD | +63.4% |
| Silver | SLV | +141.0% |
| Equities - US | ||
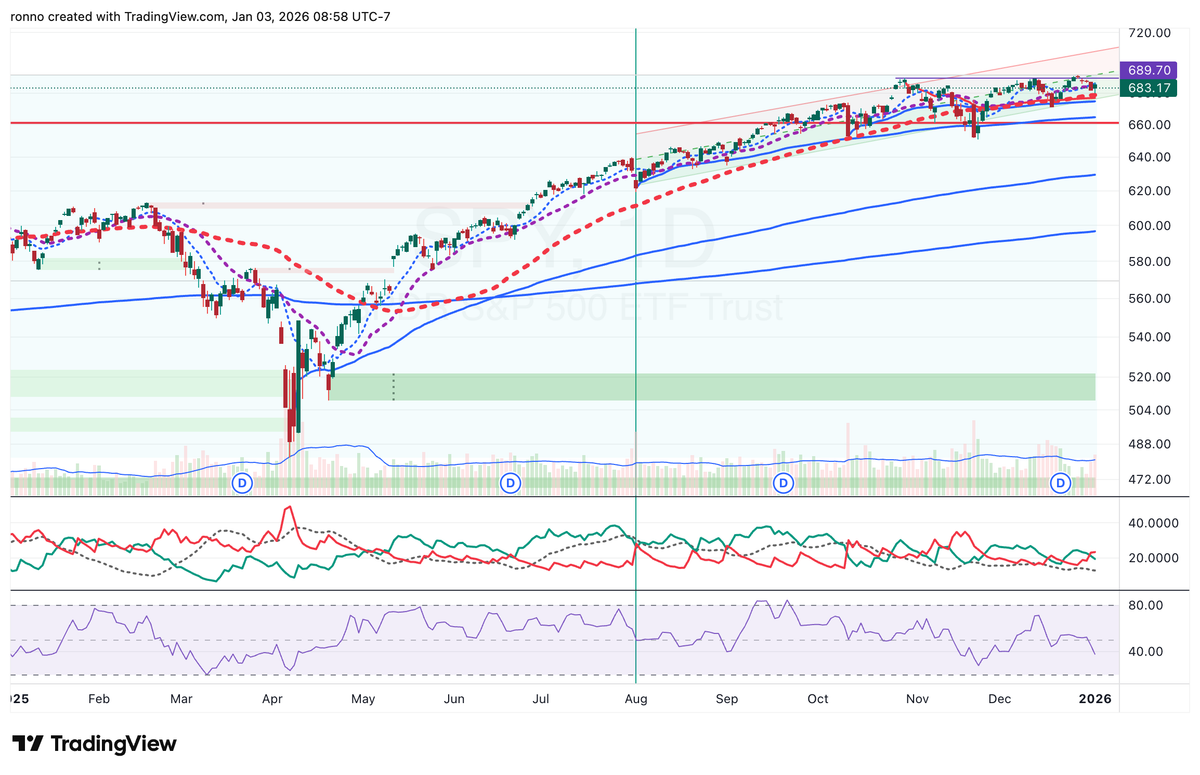
| S&P 500 | SPY | +15.7% |
| Nasdaq-100 | QQQ | +19.4% |
| Dow Jones | DIA | +12.2% |
| Russell 2000 | IWM | +10.5% |
| International | ||
| EAFE (Developed) | EFA | +26.9% |
| Emerging Markets | EEM | +30.7% |
| Europe | VGK | +31.6% |
| Japan | EWJ | +20.3% |
| India | INDA | +0.7% |
| Bonds | ||
| 20Y+ Treasury | TLT | -0.7% |
| Aggregate Bond | AGG | +2.9% |
| Corp Investment Grade | LQD | +2.9% |
| High Yield | HYG | +2.4% |
| Commodities | ||
| Broad Commodities | DBC | +3.6% |
| Sector | Ticker | 2025 Return |
|---|---|---|
| Financials | XLF | +12.8% |
| Healthcare | XLV | +12.0% |
| Industrials | XLI | +16.8% |
| Utilities | XLU | +11.9% |
| Communication Services | XLC | +20.9% |
| Technology | XLK | +22.9% |
| Consumer Discretionary | XLY | +6.5% |
| Materials | XLB | +7.2% |
| Energy | XLE | +3.3% |
| Consumer Staples | XLP | -1.4% |
| Real Estate | XLRE | -0.9% |
Major Asset Class Performance
Based on 2025 yearly candles, here are the total returns:
| Asset Class | Ticker | 2025 Return |
|---|---|---|
| Precious Metals | ||
| Gold | GLD | +63.4% |
| Silver | SLV | +141.0% |
| Equities - US | ||
| S&P 500 | SPY | +15.7% |
| Nasdaq-100 | QQQ | +19.4% |
| Dow Jones | DIA | +12.2% |
| Russell 2000 | IWM | +10.5% |
| International | ||
| EAFE (Developed) | EFA | +26.9% |
| Emerging Markets | EEM | +30.7% |
| Europe | VGK | +31.6% |
| Japan | EWJ | +20.3% |
| India | INDA | +0.7% |
| Bonds | ||
| 20Y+ Treasury | TLT | -0.7% |
| Aggregate Bond | AGG | +2.9% |
| Corp Investment Grade | LQD | +2.9% |
| High Yield | HYG | +2.4% |
| Commodities | ||
| Broad Commodities | DBC | +3.6% |
S&P 500 Sector Performance
| Sector | Ticker | 2025 Return |
|---|---|---|
| Financials | XLF | +12.8% |
| Healthcare | XLV | +12.0% |
| Industrials | XLI | +16.8% |
| Utilities | XLU | +11.9% |
| Communication Services | XLC | +20.9% |
| Technology | XLK | +22.9% |
| Consumer Discretionary | XLY | +6.5% |
| Materials | XLB | +7.2% |
| Energy | XLE | +3.3% |
| Consumer Staples | XLP | -1.4% |
| Real Estate | XLRE | -0.9% |
Precious Metals Dominated 2025
The standout story of 2025 was the extraordinary surge in precious metals. SLV skyrocketed +141% while GLD gained +63.4%. This dramatic outperformance signals heightened inflation concerns, currency debasement fears, or geopolitical risk premiums that drove investors toward hard assets.
International Markets Outperformed US Equities
A major divergence emerged: international equities crushed US markets. VGK (Europe +31.6%), EEM (EM +30.7%), and EFA (+26.9%) all significantly outpaced SPY (+15.7%). This reversal suggests:
Dollar weakness benefited foreign assets
- Valuation compression in US markets
- Better economic conditions or policy support abroad
Growth Still Led, But Modestly
QQQ (+19.4%) outperformed SPY (+15.7%), but the spread narrowed considerably versus 2024. Technology (+22.9%) and Communication Services (+20.9%) led sectors, yet the magnitude was tempered compared to prior years—indicating market leadership may be broadening.
Small Caps Lagged Significantly
IWM gained only +10.5%, underperforming large caps by 500+ basis points. This persistent weakness in small caps despite a decent equity year suggests:
- Higher borrowing costs still pressuring smaller firms
- Economic growth concerns favoring quality/size
- Lack of broad-based participation in the rally
Bonds Treaded Water
Fixed income delivered minimal returns (TLT -0.7%, AGG +2.9%), indicating rates remained elevated or volatile throughout the year. The lack of a meaningful bond rally despite equity gains suggests inflation expectations stayed sticky.
Defensive Sectors Failed
Consumer Staples (-1.4%) and Real Estate (-0.9%) were the only negative S&P sectors. This is unusual in a positive equity year and points to rotation away from defensive, yield-oriented plays—likely due to persistent higher-for-longer rate expectations.
India Stalled
INDA's near-flat performance (+0.7%) stands in stark contrast to broader EM strength, suggesting India-specific challenges (valuation concerns, political uncertainty, or profit-taking after prior years' gains).
Critical Divergences
US vs. International Equity Spread: The 11-16 percentage point outperformance by developed international and EM over US large caps represents a potential regime change. After years of US exceptionalism, global capital may be rotating.
Metals vs. Everything Else: Gold and especially silver's parabolic moves dwarf all traditional asset returns. This disconnection from equities/bonds suggests a macro fear trade or inflation hedge demand that's independent of growth optimism.
Large vs. Small Cap Gap: The 5+ point underperformance of IWM vs. SPY reveals a bifurcated market where only larger, higher-quality companies thrived.
Looking Into 2026: Key Risks & Themes
Themes to Watch:
- Can metals sustain these levels? The parabolic silver move (+141%) screams potential bubble territory or genuine paradigm shift in monetary confidence.
- International momentum: Will the rotation into non-US equities continue, or will US exceptionalism reassert?
- Rate trajectory: Bond market stagnation despite equity gains suggests the next move in rates will be decisive for 2026 asset allocation.
- Breadth deterioration: Small cap weakness and defensive sector losses indicate fragile market internals despite headline index gains.
Key Risks for 2026:
- Inflation re-acceleration (metals signal this)
- Dollar collapse scenario (would explain international outperformance and metal surge)
- Growth slowdown disproportionately hitting small caps (already evident)
- Valuation compression risk in US tech (leadership narrowing)
- Geopolitical escalation (metals as safe haven)
Bottom line: 2025 was characterized by extreme metal outperformance, international equity resurgence, and concerning internal weakness (small caps, defensives). The market appears to be pricing in either inflation concerns or loss of confidence in fiat currencies, themes that could dominate 2026 if they persist.