NASDAQ’s Struggle Signals Market Risk
While SPY and IWM are making new highs, QQQ is still struggling.
The S&P 500 and Russell 2000 are making new highs. The NASDAQ 100 is not. The divergence is worrisome.
The Setup
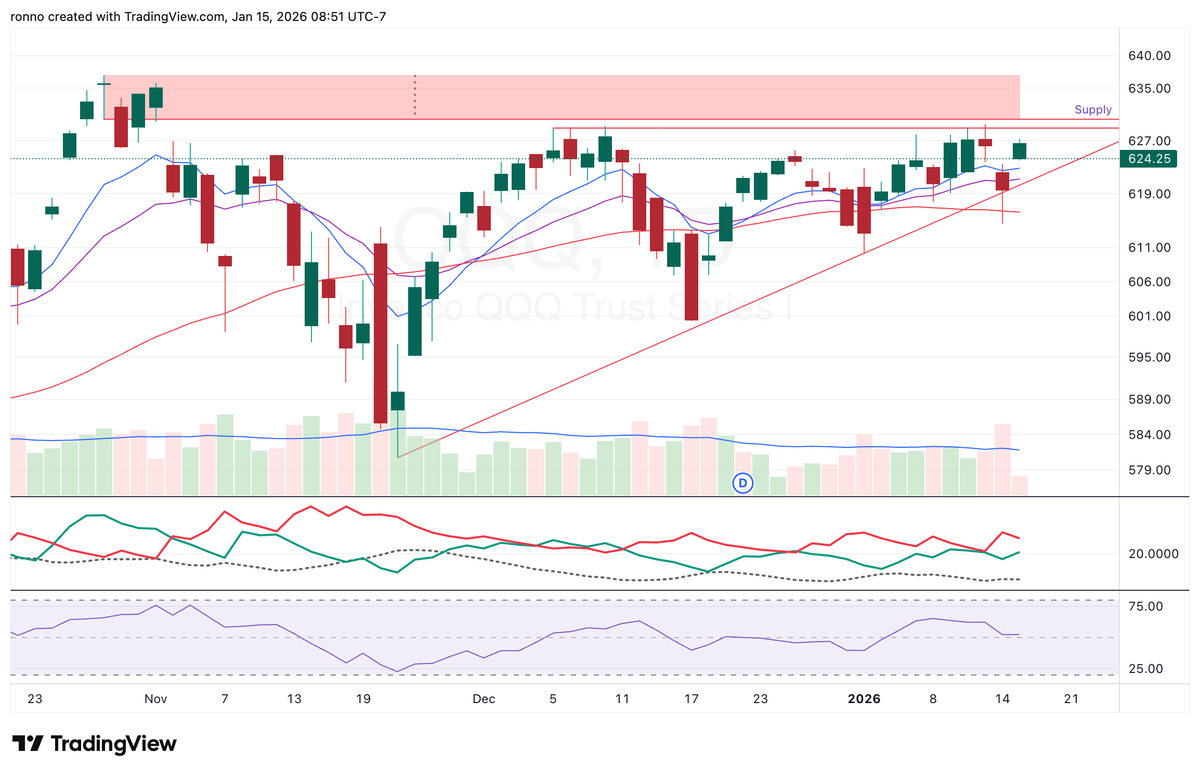
QQQ continues to reject near the 630 to 637 supply zone, failing to confirm breakouts in the broader market. The daily chart shows price consolidating below resistance with moving averages flattening out. ADX around 20 indicates no trending condition, just chop.
Meanwhile, the 50 day MA has crossed below the 200 day for some of the Mag 7 names, and relative strength in large cap growth versus value is at multi month lows.
The Concern
When the index that led the bull market can't participate in new highs, it signals deteriorating leadership. The S&P 500 is market cap weighted toward the same tech giants dragging on QQQ. If they don't catch a bid soon, the math becomes problematic.
Key Levels
For me, QQQ needs to clear 637 convincingly to invalidate this divergence. Support sits around 614 (recent swing lows) and 583 (200 day MA). A close below 614 with volume would confirm distribution.
Takeaway
This isn't a sell signal, but it is a caution flag. Tighten stops, be selective on new longs, and watch for resolution. The divergence either gets bought or it doesn't.