QQQ Headwinds
QQQ opened the week at 619.32 on Jan 5, slipped to 617.99, then rallied to 623.63 on Jan 6, 624.19 on Jan 7, retraced to 620.47 on Jan 8, and finished at 626.70 on Jan 9 – a net gain of ~1.5 % over five days. The exponential moving averages have held steady: EMA5 = 624.42, EMA9 = 622.57, EMA20 = 620.45, EMA50 = 617.02. With the close above EMA5 and well above EMA20/EMA50, the price is now in a bullish alignment, signaling a breakout from the recent consolidation.
The VIX stayed subdued, sliding from 14.90 (Jan 5) to 14.51 (Jan 2) and 14.95 (Dec 31), indicating low‑level volatility and a supportive risk‑on environment. Macro news – a stronger ISM services PMI, mixed jobs data, and overall market optimism – reinforces the bullish tone, with analysts expecting QQQ to lead the broader rally.
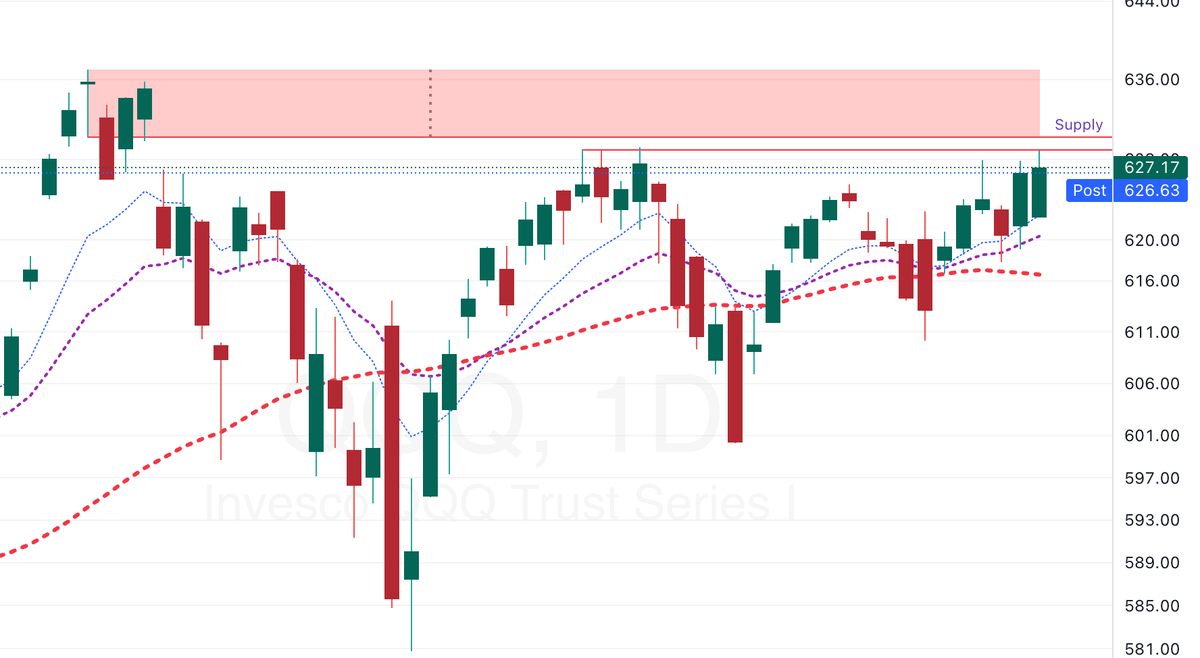
Technically, resistance now sits around 628‑630 (recent swing highs) while support resides near 620 (EMA20). The price crossing above EMA5 suggests upward momentum; a close above 628 could target the 635‑640 zone.
TICKER: QQQ