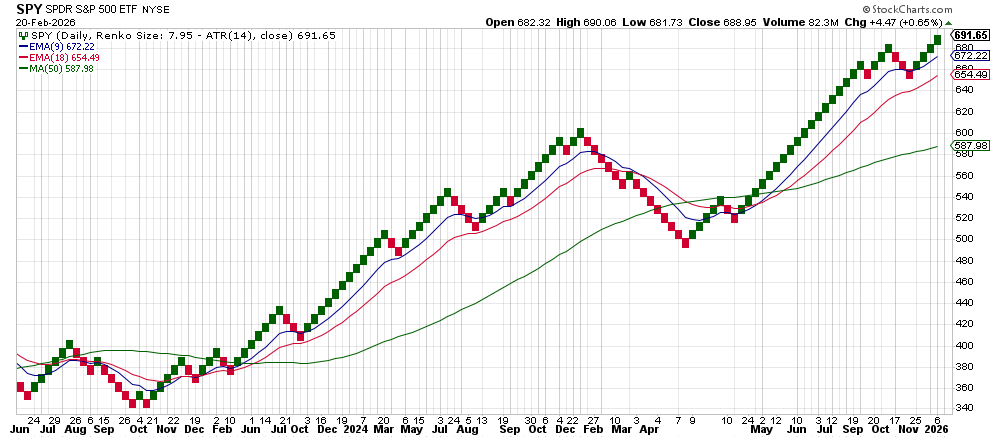
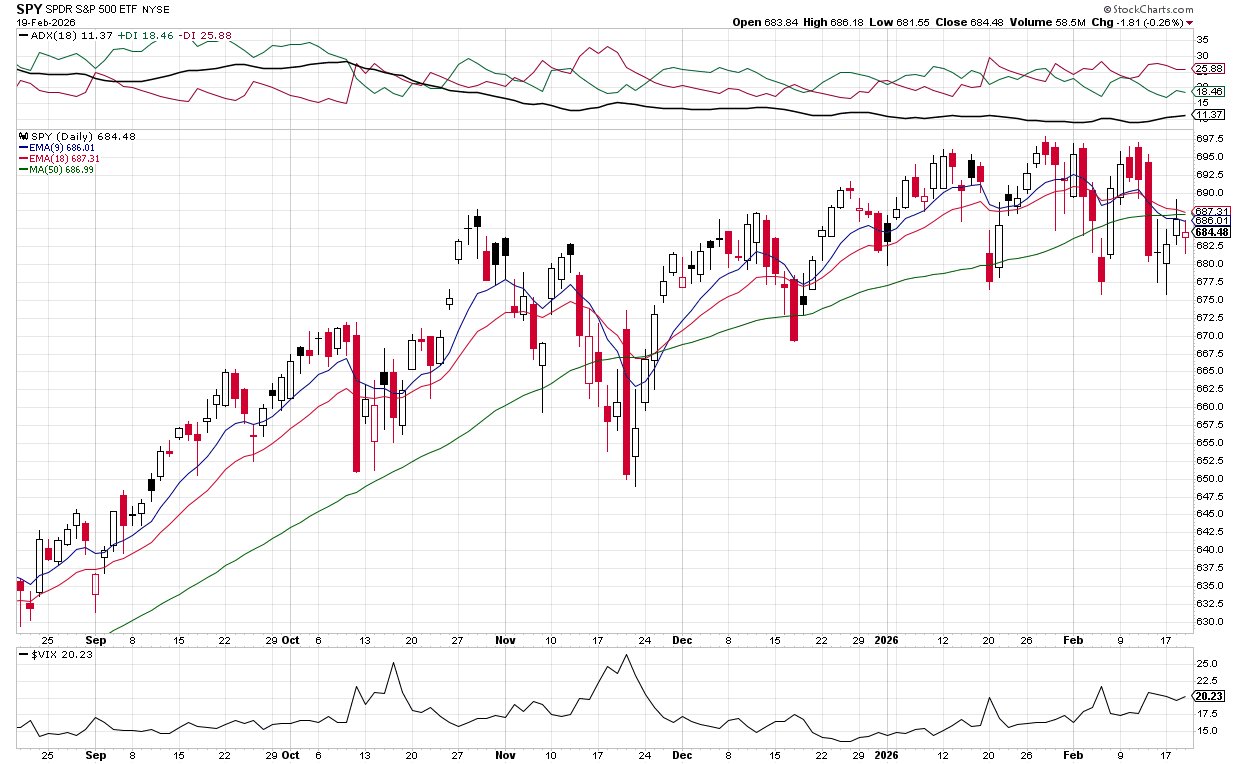
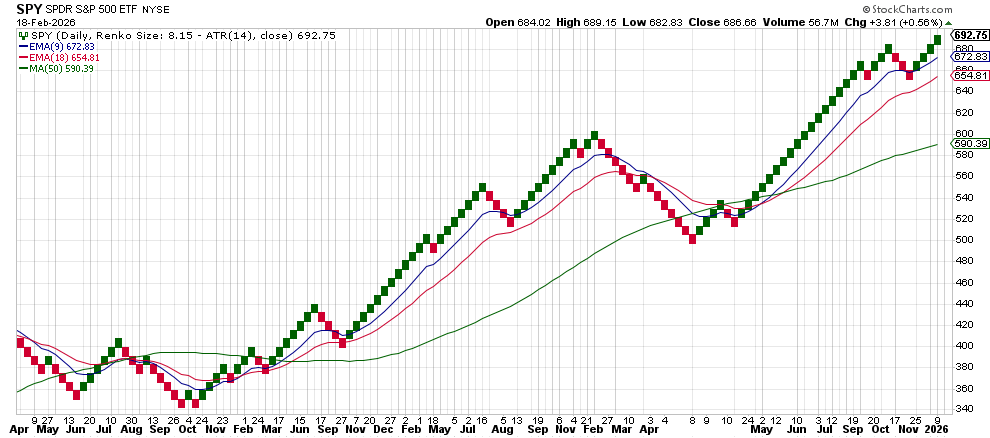
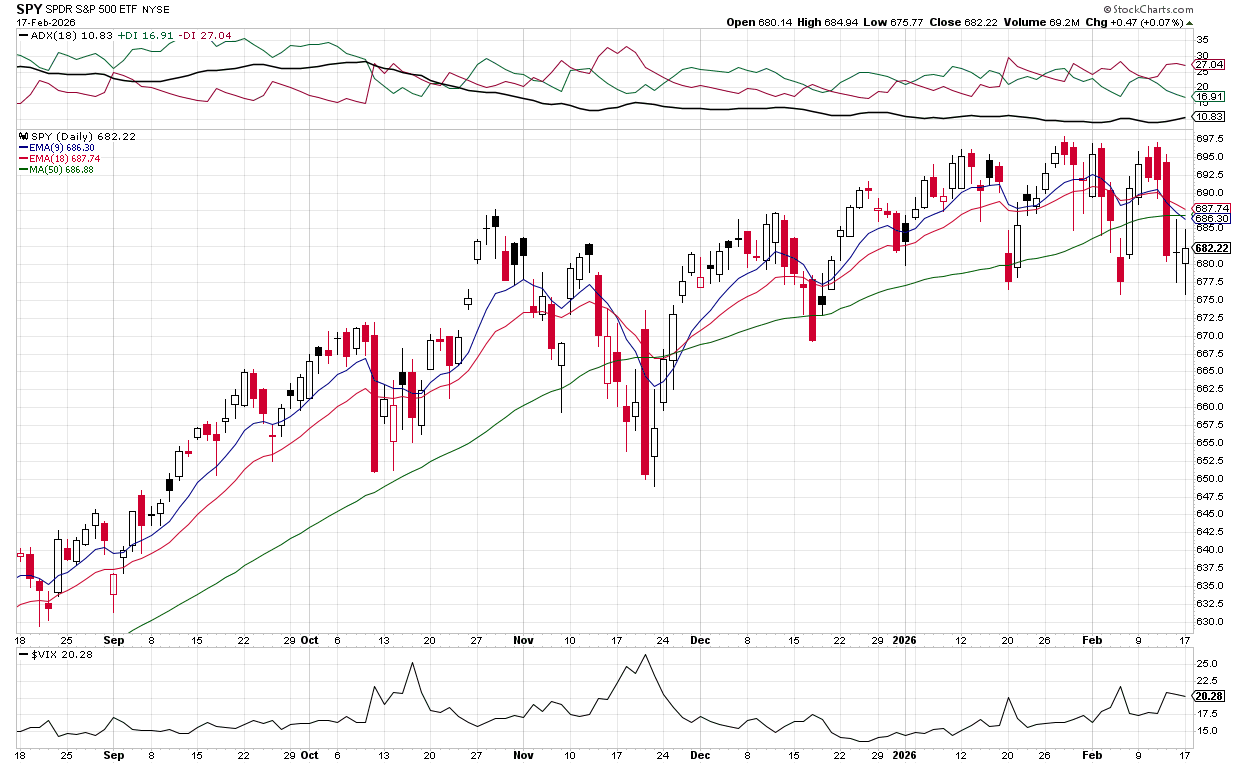
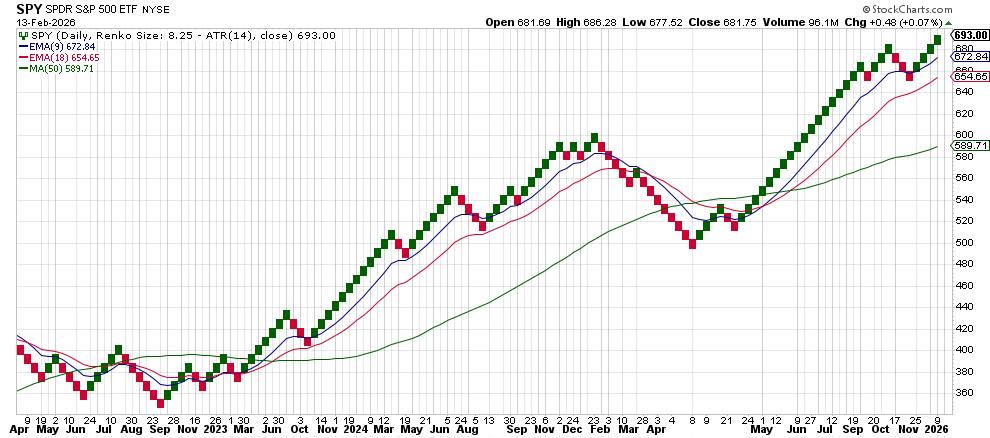
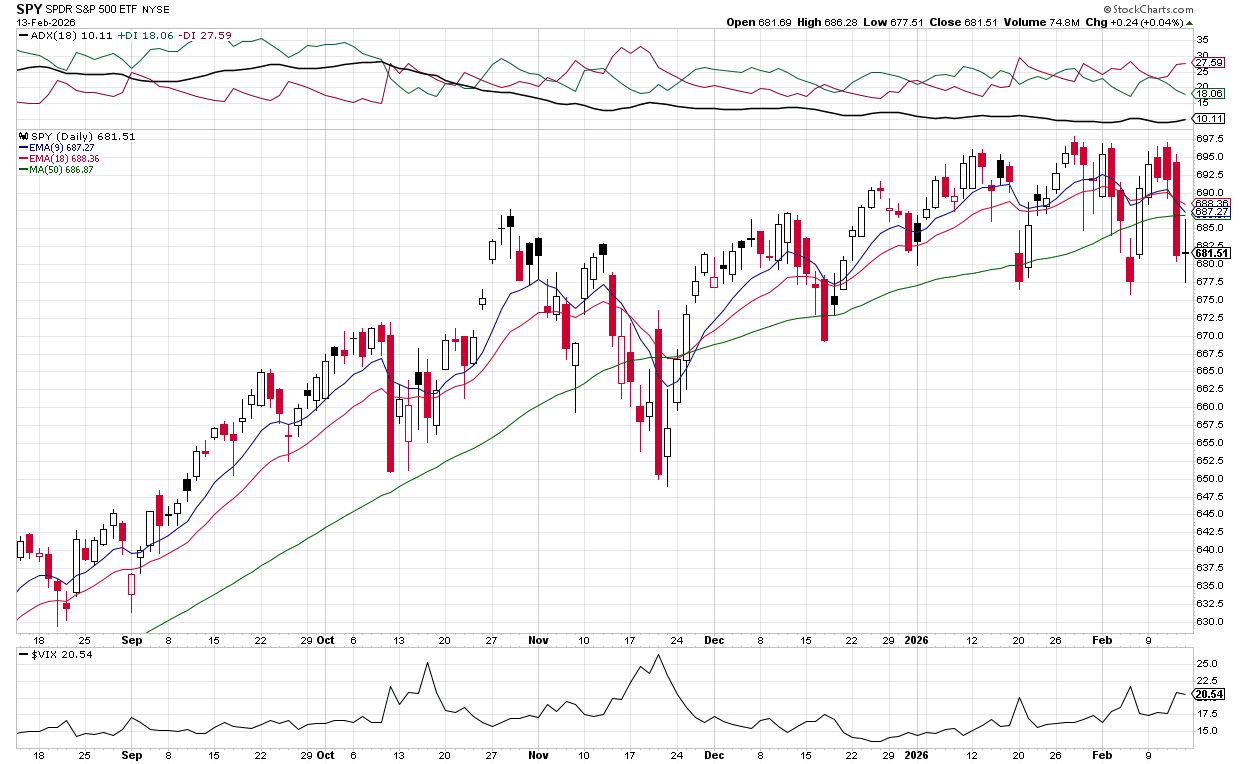
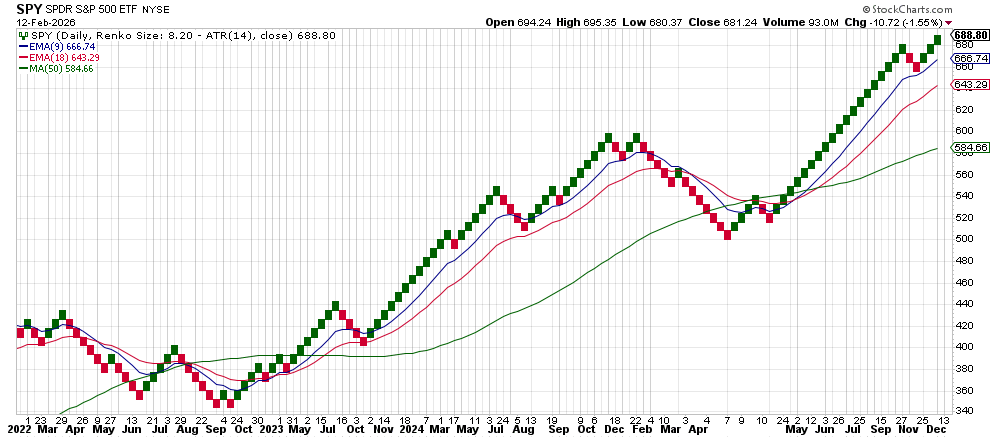
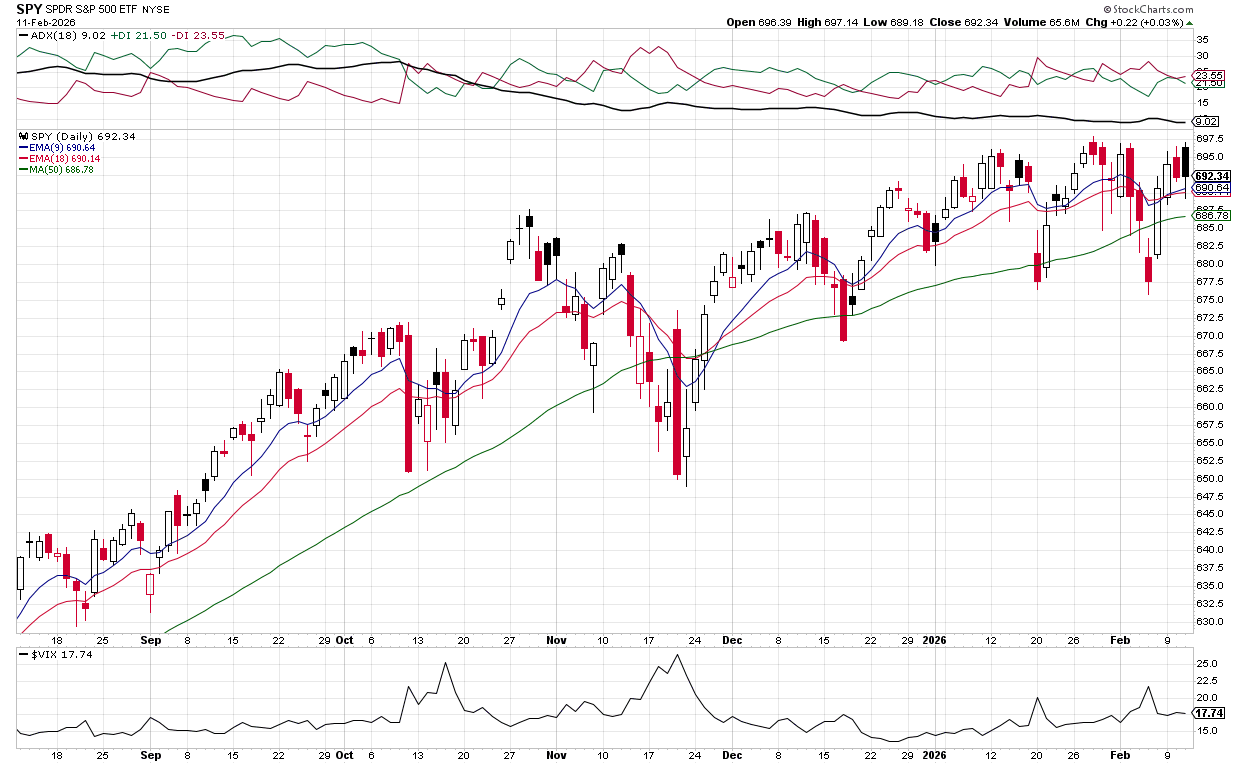
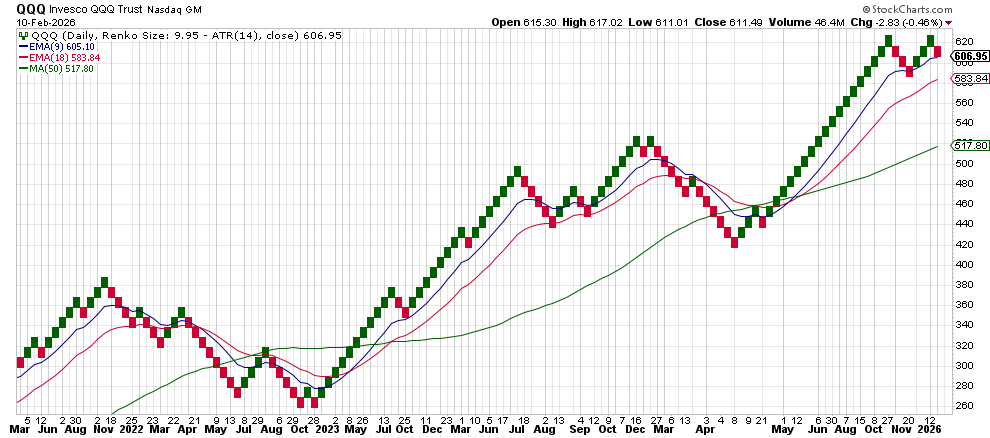
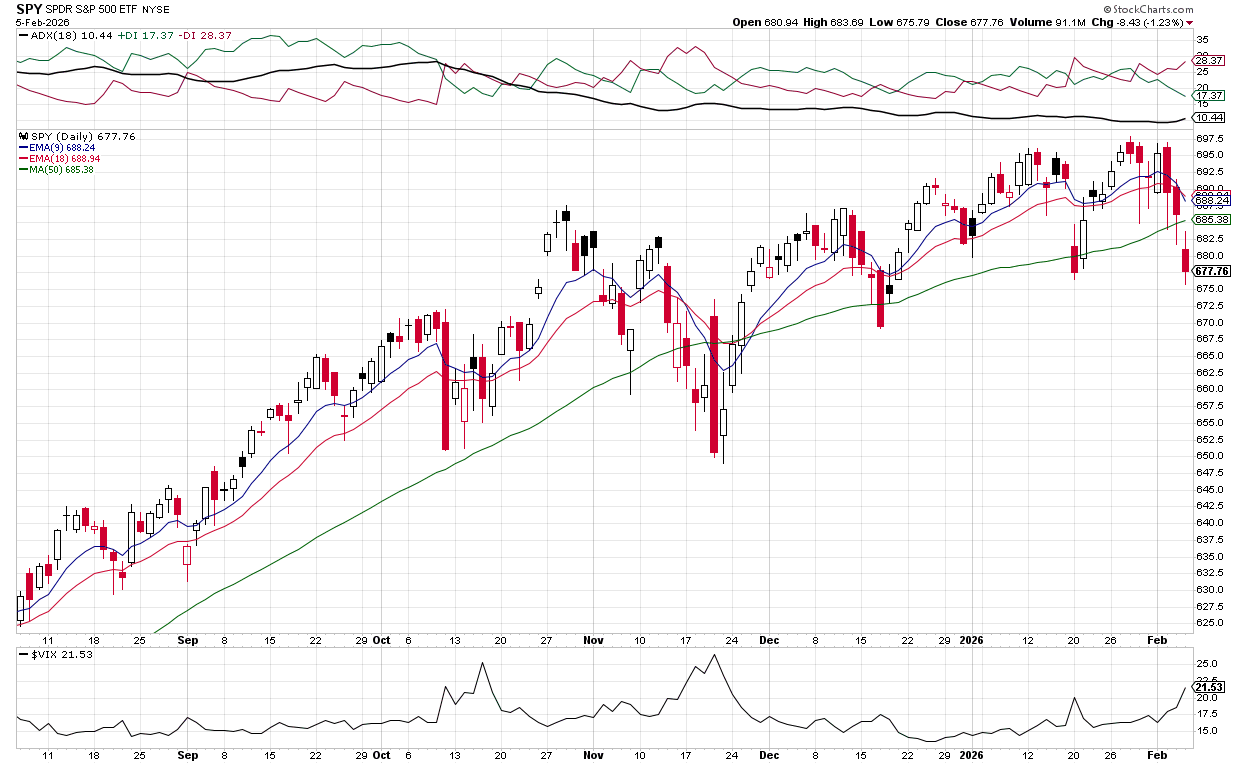
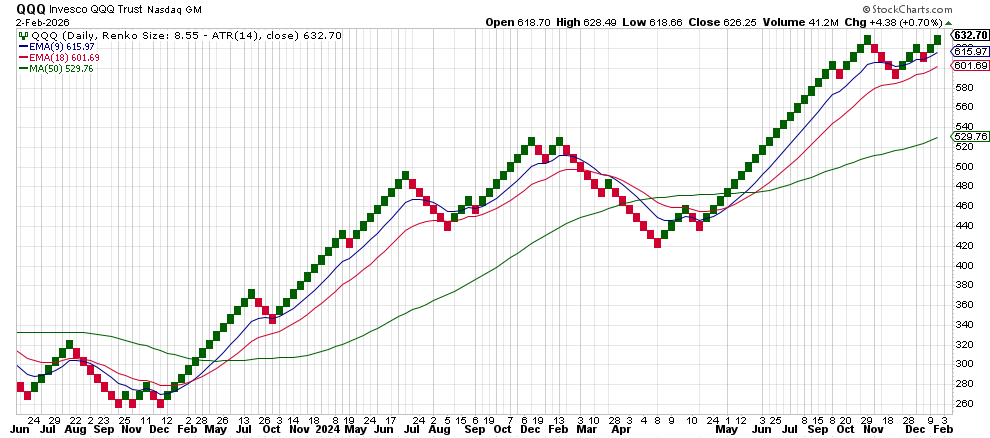
Markets Cautious Outlook Amid Stalling Momentum * QQQ closed at 601.92 (Feb 13) and 603.47 (Feb 19), struggling to gain above 605 EMA5. * SPY held near 681–684 range, failing to break EMA20 (687.52) or reclaim 6889—an apparent near-term ceiling. * Volatility (VIX) trended lower after spiking mid-week, but remained elevated (20.
Markets Cautious Outlook; Awaiting SPY Breakout Stocks are showing minor losses as markets consolidate near recent levels. The SPY is trading below all its key exponential moving averages (EMA5, EMA9, EMA20, EMA50), indicating a short-term downtrend remains in place. Market sentiment is mixed, with retail investors turning slightly bearish while institutional managers are more optimistic.
Markets Cautious Outlook Amid VIX Retreat The market shows mixed signals after a volatile week. While the VIX has retreated from 21.20 to 20.29, indicating decreasing fear, QQQ and SPY are trading below key EMAs. Both ETFs have experienced price declines with resistance around EMA levels, suggesting ongoing pressure. The technical picture remains cautious
Markets Cautious Outlook; Volatility Tests Support The market showed signs of consolidation and increased volatility last week, with the SPY briefly breaking below key support levels before recovering. The index closed the period near its lows, indicating ongoing selling pressure. The VIX ticked higher, reflecting growing investor unease. Technically, the price is trading below its key
Markets Cautious Outlook Amid Pullback Major indices faced a noticeable downturn over the past week, pulling back from recent highs. Both the SPY and QQQ broke below key support levels, closing lower for the week. The significant drop on February 12th, accompanied by a sharp spike in the VIX, indicates a rise in market fear.
Markets Bearish Outlook; VIX Spikes Major indices pulled back sharply on February 12th, erasing the gains from earlier in the week. The SPY closed significantly lower after breaking below key support levels. This sell-off coincided with a notable spike in the VIX, which jumped from the 17s to over 20, indicating a sharp rise
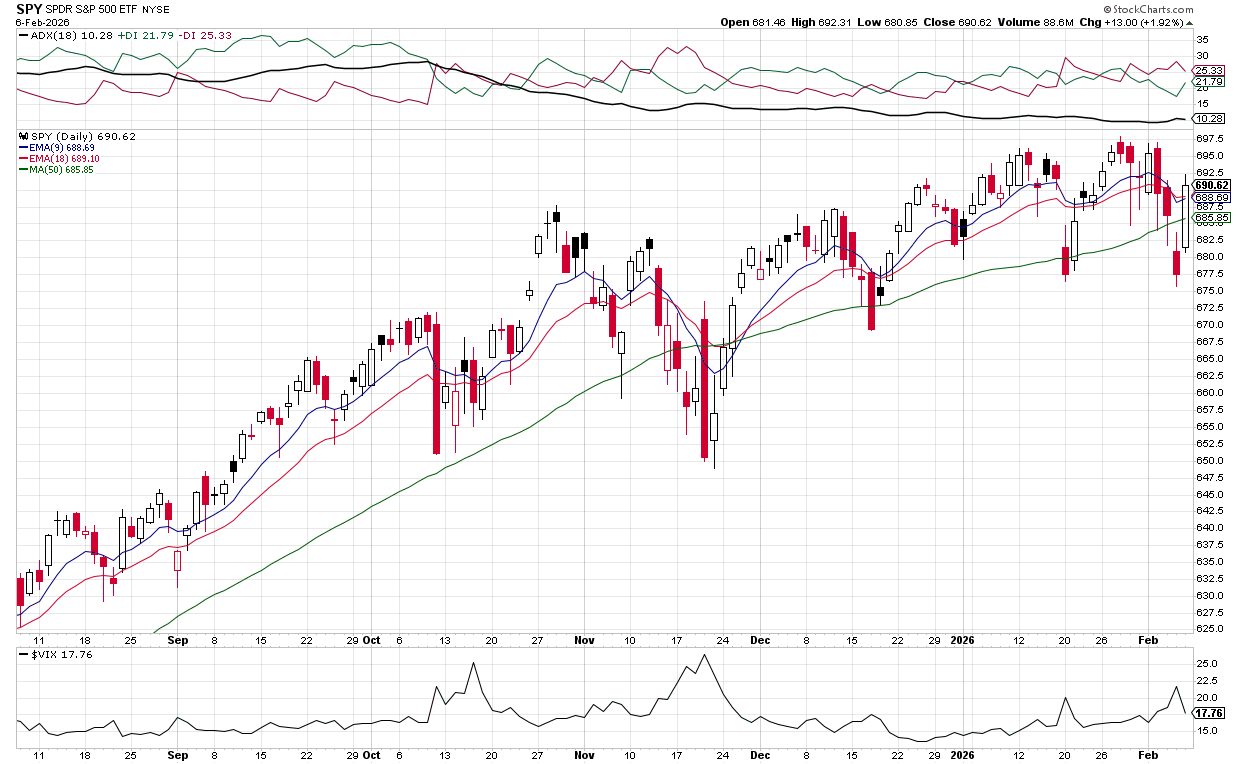
Markets Cautious Outlook Amid Resistance Major indices showed resilience but struggled to make decisive moves higher last week. Both SPY and QQQ attempted to advance but faced clear resistance near their key moving averages. The SPY failed to sustain a break above its 50-day EMA, while the QQQ encountered selling pressure around its 20-
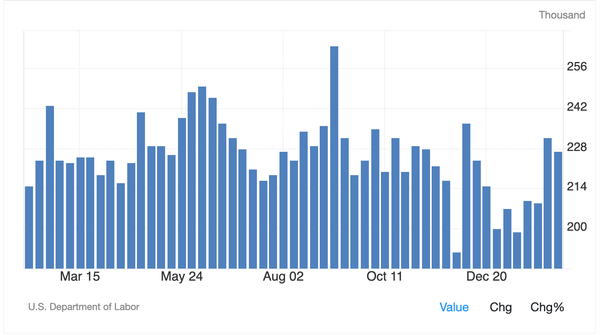
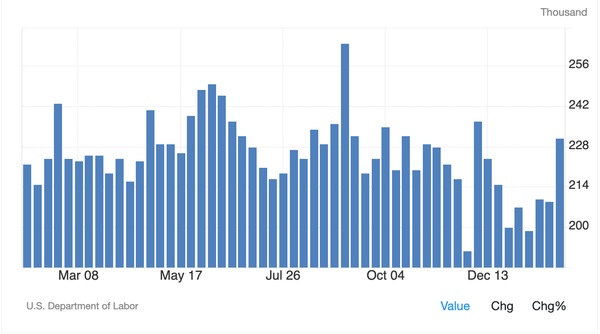
Markets Initial Jobless 227K, expected at 222K US jobless claims dipped slightly to 227,000 last week, still above the expected 222,000 and hovering near an eight week high. Continuing claims also ticked up to 1.86 million, with winter storms across the country largely blamed for the uptick as disrupted businesses pushed more people to
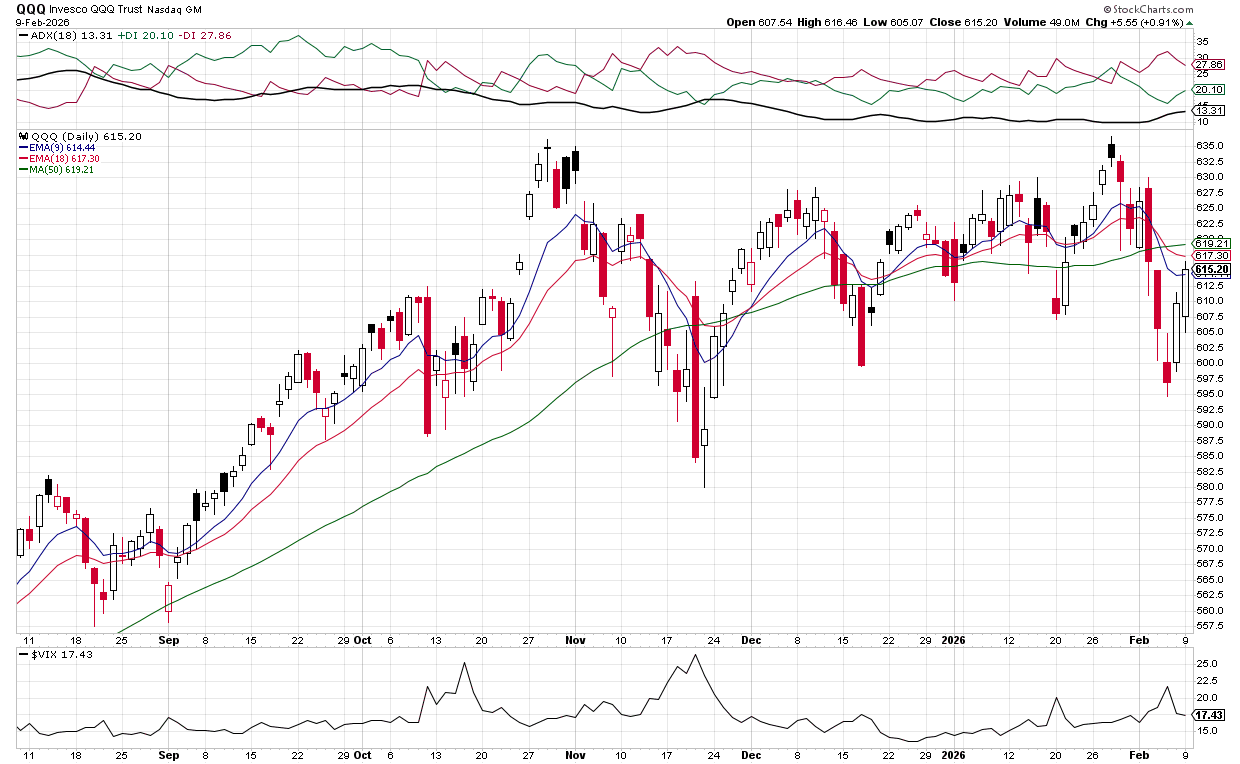
Markets Cautious Outlook on Tech Rebound The QQQ attempted a rebound last week after a dip below $600, but faces significant resistance near its key moving averages. The ETF closed the week at $611.25, which remains below its declining 5, 9, 20, and 50-day EMAs. This suggests the short-term trend is still under
Markets Cautious Outlook as QQQ Tests Resistance The QQQ showed mixed signals last week, closing at $609.65 after testing resistance around the $611-$614 level. While the index managed to recover from lows near $595, it faces significant technical hurdles with all key EMAs (5, 9, 20, and 50-day) converging in the $611-$618 range.
Markets Americans are Searching Like It's 2008 While headline economic data often shows a resilient economy, a closer look at human behavior reveals a much more fragile reality. According to Google Trends, Americans are currently job searching at levels that echo the Great Recession, marking a significant shift in the U.S. labor market The "Low-
Markets Cautious Outlook; Tech Resistance The recent price action in QQQ highlights ongoing sector rotation and a challenging technical picture for Technology. After a sharp selloff earlier in the week, QQQ managed a significant rebound on Friday, February 6th, closing near the highs of the day. However, this rally faces immediate resistance near the $609-
Markets Cautious Outlook; Tech-Lagging The first week of February has been marked by significant volatility, particularly in the technology-heavy QQQ. After a strong start, the index sold off sharply mid-week, breaking below key support levels. While a late-week recovery pushed prices higher, QQQ failed to recoup its early-week highs. The
Markets Indecisive - Tech Drag vs Fed Support The market shows conflicting signals as QQQ declined 3.8% from Jan 29 to Feb 4, falling from 629.37 to 605.75. Meanwhile, SPY held relatively better, down only 1.1% to 686.19. The divergence reflects tech weakness offset by strength in financials, industrials, and consumer sectors. VIX
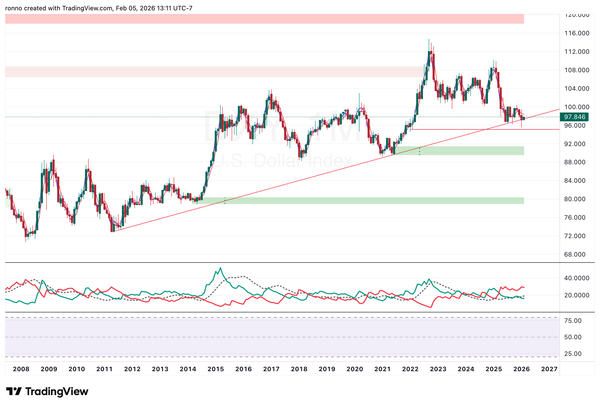
Markets The Dollar's 14-Year Support Trendline The relationship between the US Dollar (USD) and gold is currently at a critical technical juncture, as the dollar sits on the edge of a 14-to-15-year support trendline. Some indicate that this level is a "danger zone" for the currency, and its potential breakdown could
Markets Initial Jobless Claims at 231,000 US initial jobless claims rose by 22,000 to 231,000 in the last week of January, exceeding expectations of 212,000 and reaching the highest level in nearly two months. Continuing claims also increased by 25,000 to 1.844 million. The rise was largely linked to winter storms
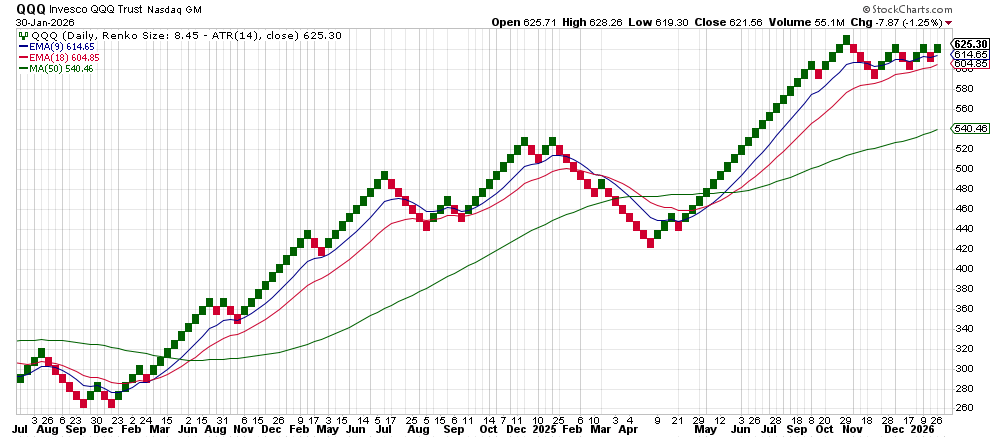
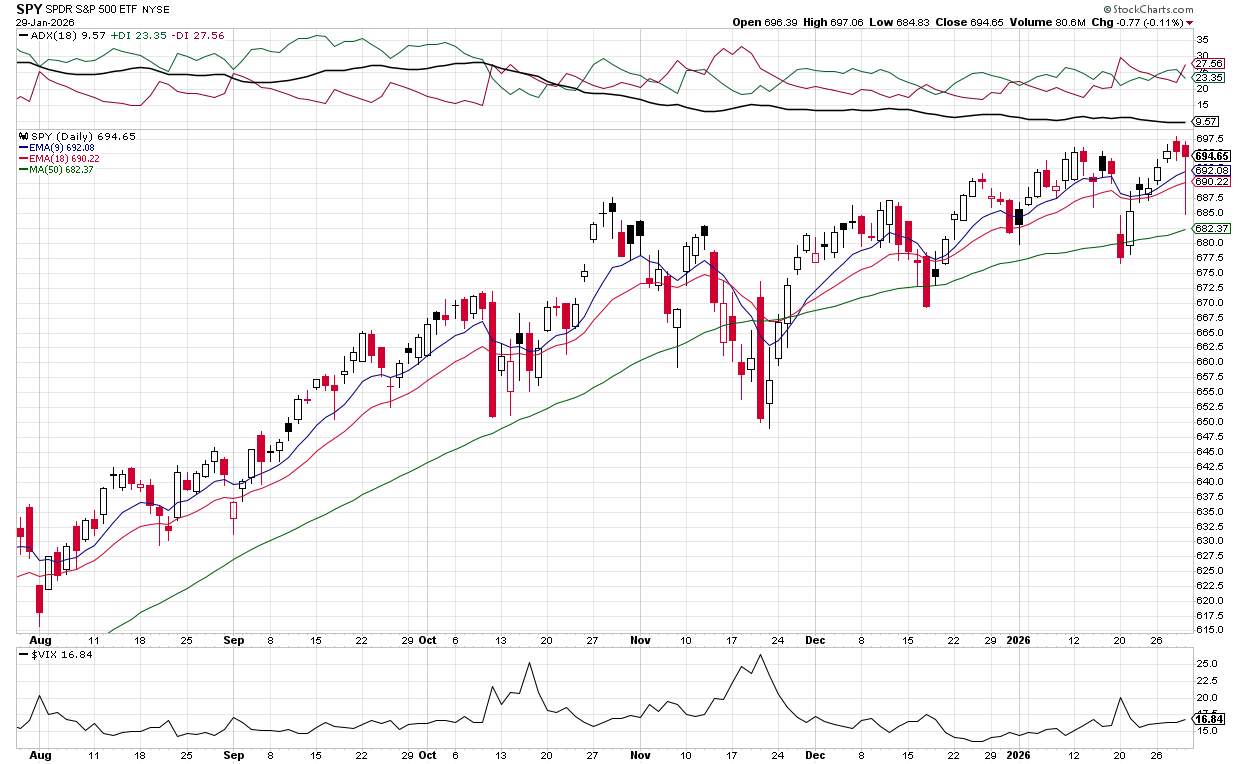
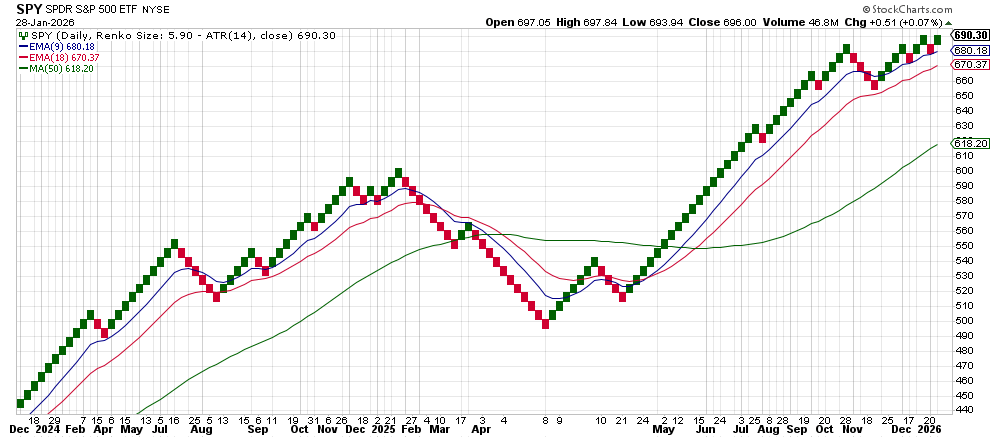
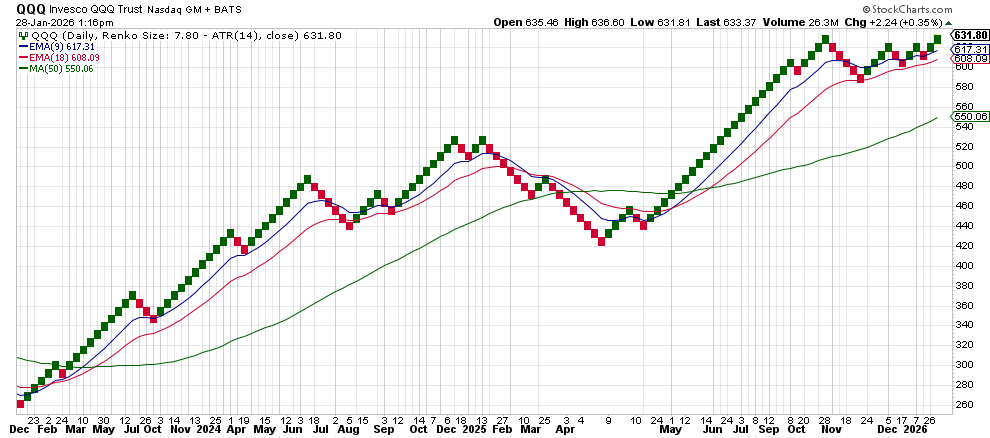
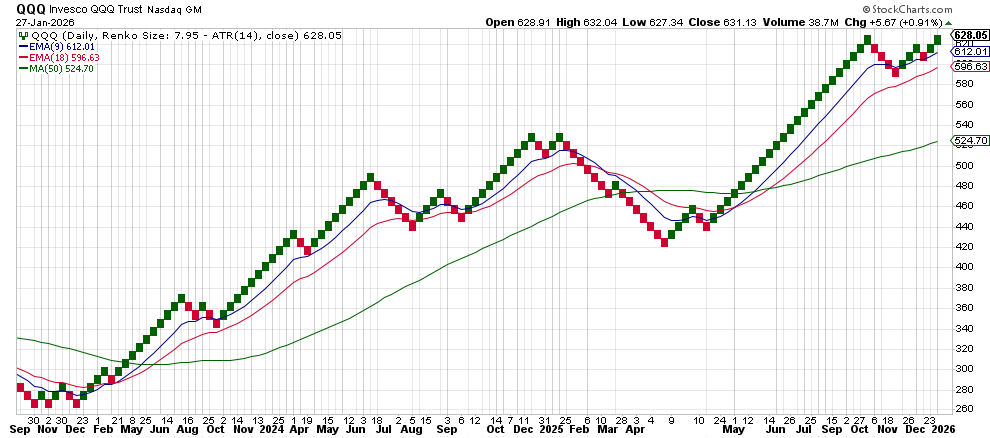
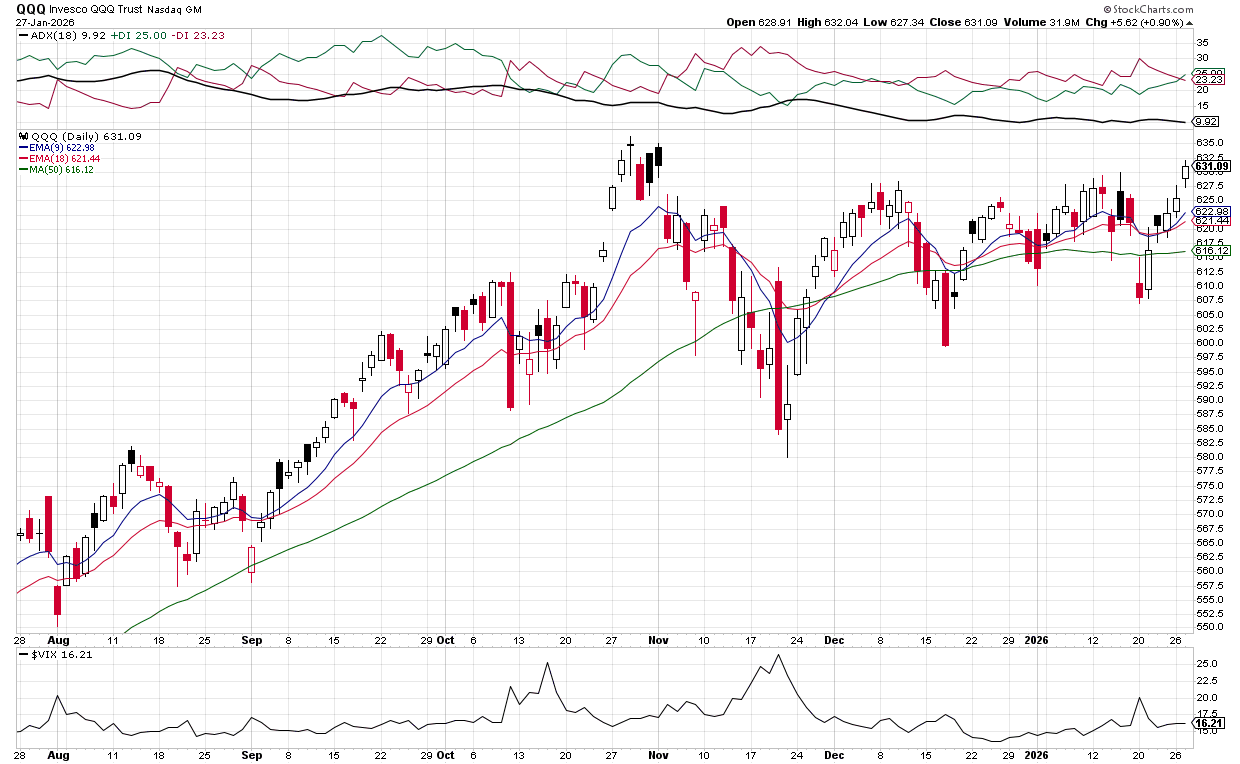
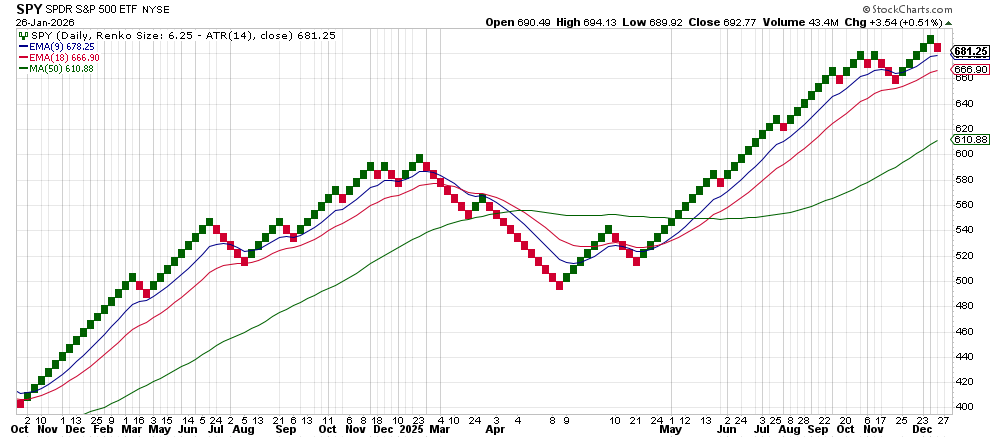
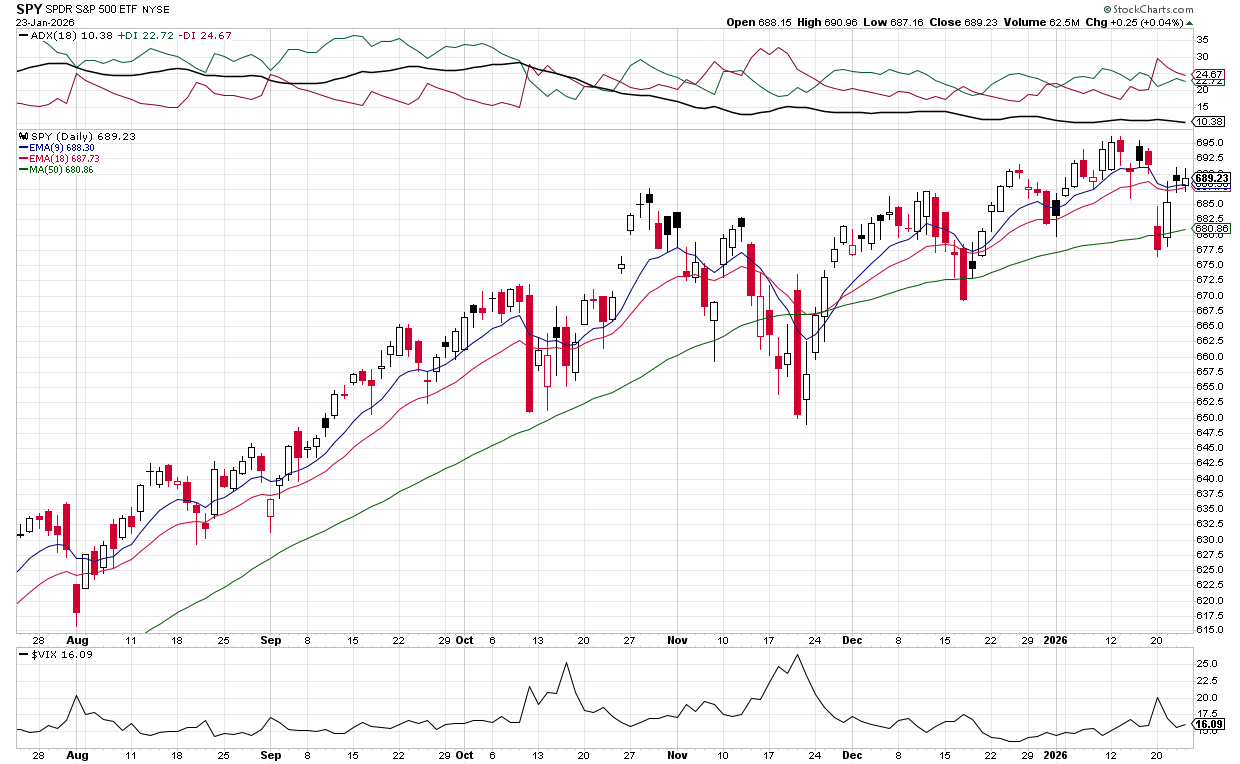
Markets Bullish QQQ breakout * QQQ surged above $630 on Jan 30, confirming a breakout from a symmetrical triangle and signaling a likely move toward $650‑$655 into late February. * SPY stayed near its recent highs (~695‑696) but lagged the tech‑driven rally. * EMAs for both ETFs remained flat, indicating a pause before the
Markets Bullish QQQ Hits $630 * QQQ price action (2026-01-23 to 2026-01-29): * 2026-01-23: Open $619.73, High $625.40, Low $618.65, Close $622.72 * 2026-01-26: Open $623.21, High $627.61, Low $622.12, Close $625.46 * 2026-01-27: Open $628.91, High $632.04, Low
Markets Bullish QQQ & EMA * QQQ 2026‑01‑22: Open 622.35, High 622.46, Low 617.78, Close 620.76 * QQQ 2026‑01‑23: Open 619.73, High 625.40, Low 618.65, Close 622.72 * QQQ 2026‑01‑26: Open 623.21, High 627.61, Low 622.12, Close 625.46 * QQQ 2026‑
Markets Bullish Tech Momentum Building * QQQ gained 3.5% this week (609.47→631.06), approaching 630 resistance level * SPY up 2.3% (679.65→695.51) with consistent higher highs/lows * VIX remained low at 16.1-16.4, indicating stable investor sentiment * EMAs suggest building momentum below short-term but above long-term
Markets Bullish QQQ Triangle Up * QQQ closed at $616.28 (Jan 21), $620.76 (Jan 22), $622.72 (Jan 23), $625.46 (Jan 26), $631.06 (Jan 27), breaking above $630. * EMA values: 5‑day 627.36, 9‑day 624.88, 20‑day 622.65, 50‑day 619.47 throughout the week. * VIX fell to
Markets Market Update * Broke $630 resistance level on Jan 27, closing at $631.06 * Current price above all EMAs: EMA5 ($624.82), EMA9 ($622.99), EMA20 ($621.50), EMA50 ($618.80) * VIX remains low at 15.64-16.15, indicating stable market sentiment * Breakout from symmetrical triangle pattern, per journal entries, with targets
Markets Bullish QQQ regains EMA * QQQ closes rose from 608.06 (Jan 20) to 625.46 (Jan 26), a 2.9% gain over five sessions. * EMA5 = 624.98, EMA9 = 623.09, EMA20 = 621.55, EMA50 = 618.83; price is now just above EMA5 and EMA9. * VIX edged up to 16.15 (Jan 26) from 15.
Markets Bullish QQQ Above 619 * QQQ Jan 23: 622.72 close (up from 608.06 Jan 20 low) * SPY Jan 23: 689.13 close (up from 677.56 Jan 20 low) * QQQ EMAs: 5(621.71), 9(620.98), 20(620.38) * VIX decline: 16.90 → 16.09 → 16.09 (3-day trend) * Market breadth
Markets Bullish QQQ Recovery Underway * QQQ close: 621.26 → 608.06 → 622.72 (3-day recovery) * EMA levels: 5(619.80), 9(619.84), 20(619.77) - all converging * VIX declining: 20.09 → 15.64 (volatility compression) * Recovery rate: +2.4% from low, still below Jan 19 close * Key level: Need closing above 619 for